Visualising data in presentations

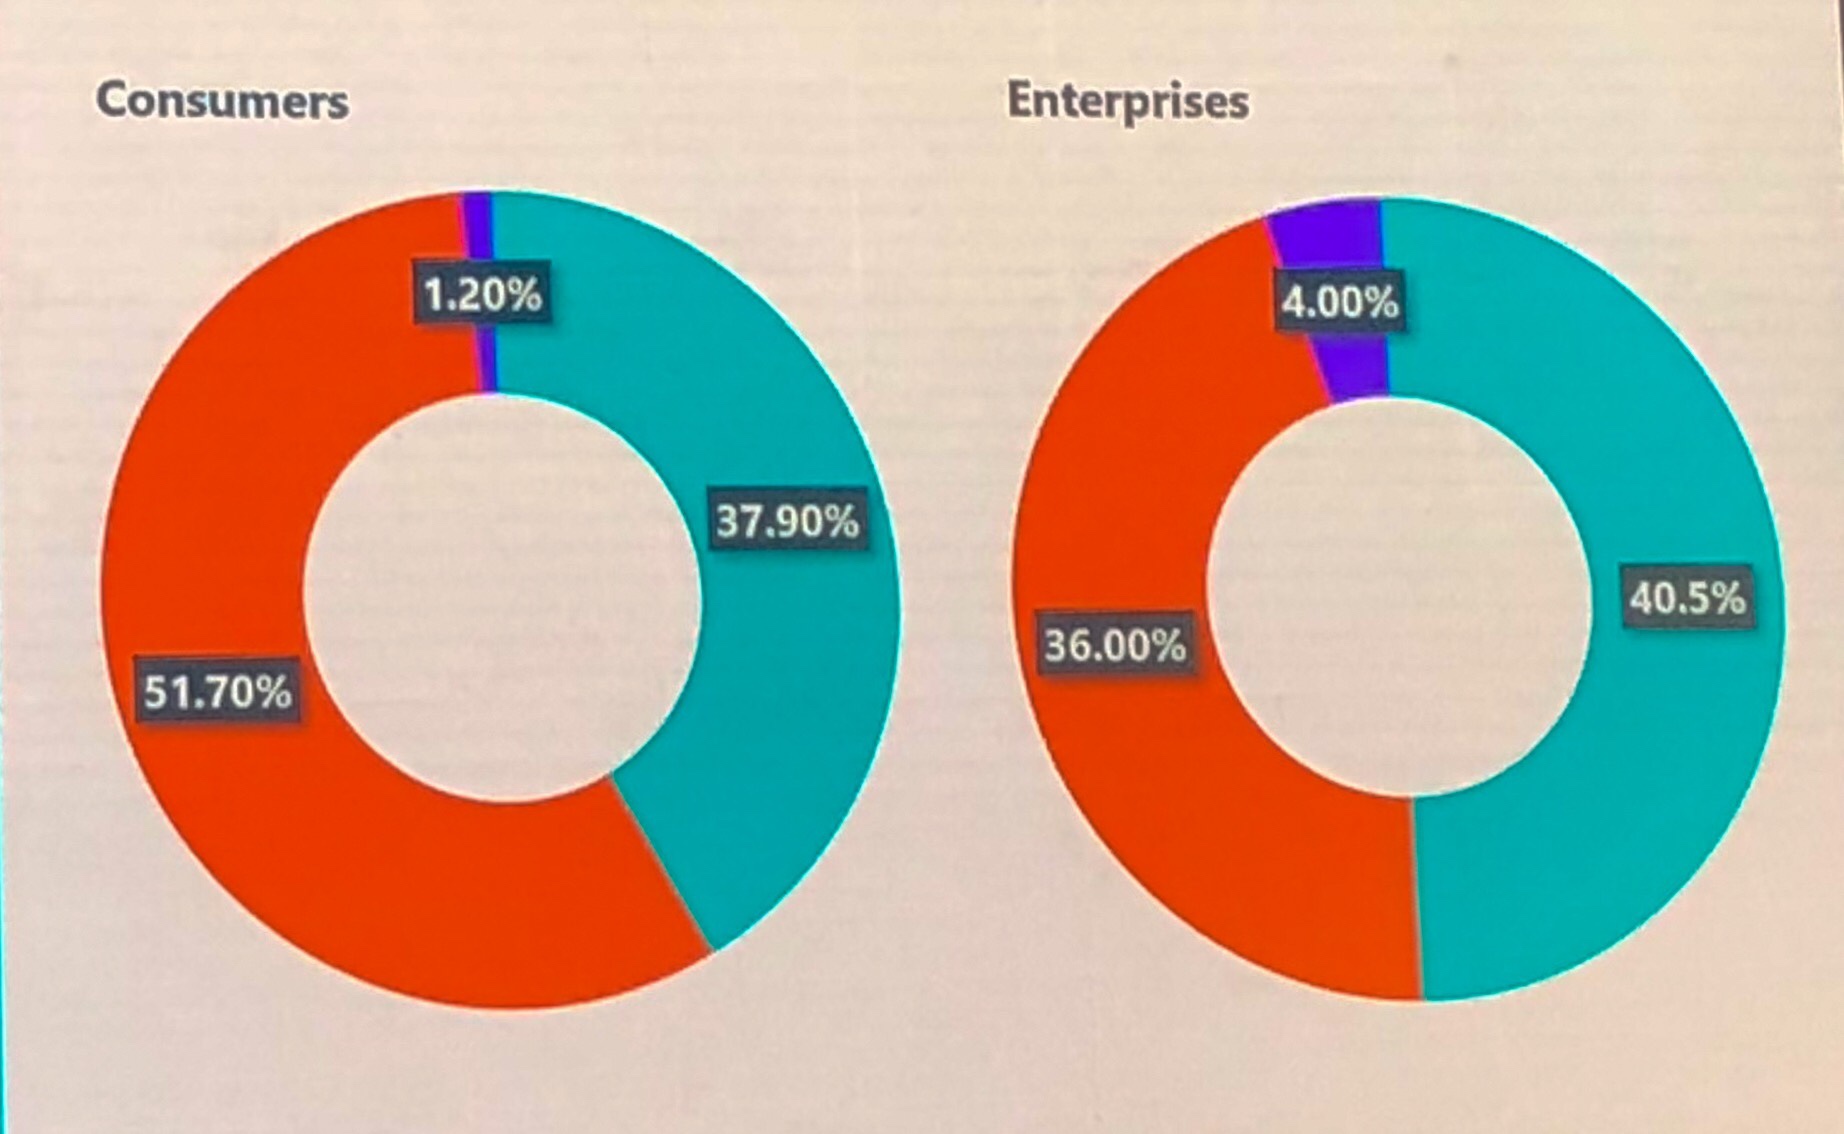
If your graphs don’t visually illustrate the percentages associated with them I literally stop listening to the point being made. It’s often not the speakers fault, and I don’t consciously stop listening up in my high horse, I just get so caught up in the inaccuracy that I can’t focus on what’s being said.

What could really increase your life expectancy, lifespan and longevity?

I love visualisations of any sort, but ones that show me how to live longer have to be a favourite. What could add years to your life? Why do women live longer than men? What’s the best method of life extension? Diet and exercise? Or polygamy and pets? Let the latest data decide. — Read… Continue reading What could really increase your life expectancy, lifespan and longevity?

Quantum Tapestry

Beautiful Programming — Click to randomize and reset animation. Press “A” to toggle autoplay – autoplay will automatically clear and redraw the screen when it is full. Press “R” to reset the draw color to white. Press “C” to randomize the current draw color. This sketch was made with Processing 2 in Javascript mode. Visit… Continue reading Quantum Tapestry