I came across this twitter account while going down a rabbit hole of linked tweets at 1am this morning. The images are super simple but do a great job of supporting the content that go along with them, here are some examples below. Constraint increases creativity This is something that I tend to hear from… Continue reading Visualising Value
Tag: visualisation
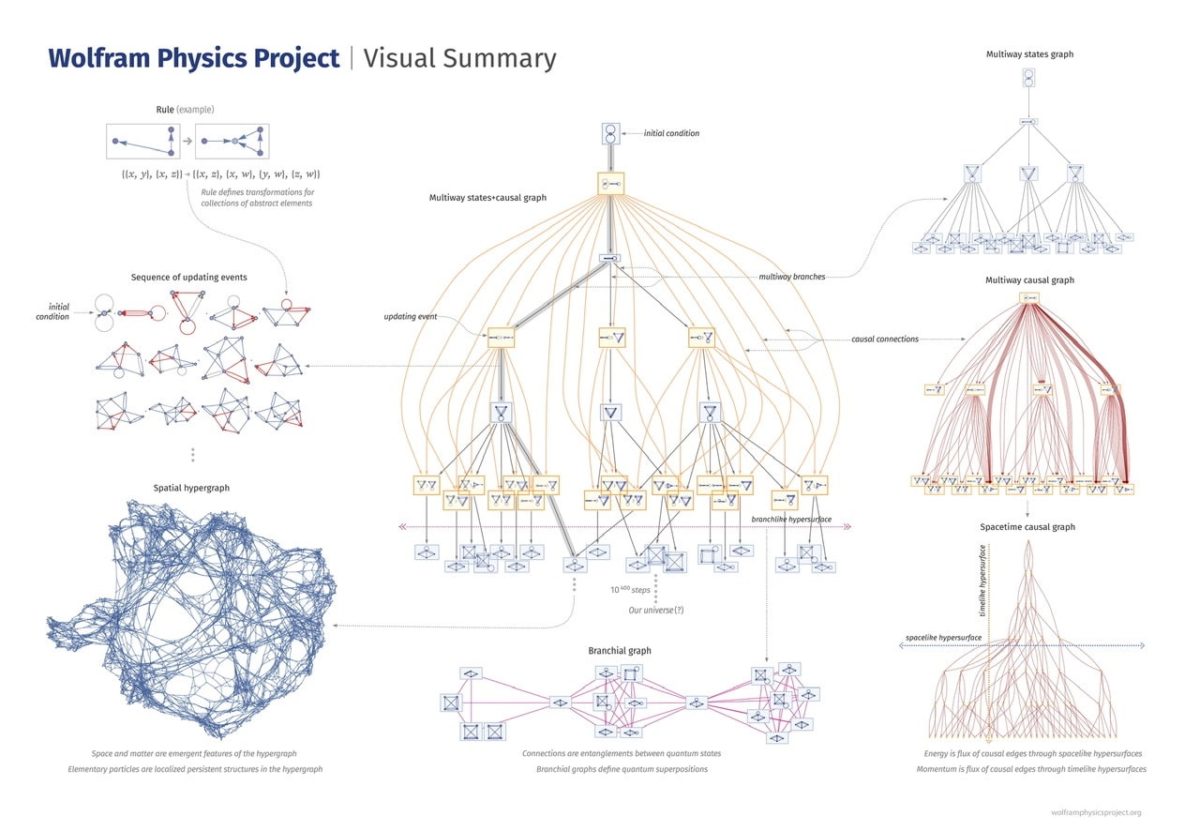
Visual Summary of the Wolfram Physics Projects
From rule to potential universe hypergraph, a visual representation of states and graph types. — Read on www.wolframphysics.org/visual-summary/
The D3 Graph Gallery – Simple charts made with d3.js
The D3 graph gallery displays hundreds of charts made with D3.js, always providing the reproducible code. — Read on www.d3-graph-gallery.com/
Charts | Create charts and maps with Datawrapper
Create interactive, responsive charts with Datawrapper – no code or design skills required. — Read on www.datawrapper.de/charts/
Quantum Tapestry
Beautiful Programming — Click to randomize and reset animation. Press “A” to toggle autoplay – autoplay will automatically clear and redraw the screen when it is full. Press “R” to reset the draw color to white. Press “C” to randomize the current draw color. This sketch was made with Processing 2 in Javascript mode. Visit… Continue reading Quantum Tapestry
Monitor and Manage your Elasticsearch cluster
Elasticsearch have just announced an amazing new product: Elasticsearch Marvel. Marvel is a monitoring and cluster management dashboard enabling you to understand and visualize the health and status of your Elasticsearch infastructure. Visit Link
Bridle JavaScript Charting Library
Bridle is a repository of charts built following the reusable chart paradigm. The library is in its infancy, and still requires a bunch of work. We decided to still use d3 to invoke the chart, so that you can integrate them in your d3 workflow as seamlessly as possible: Visit Link