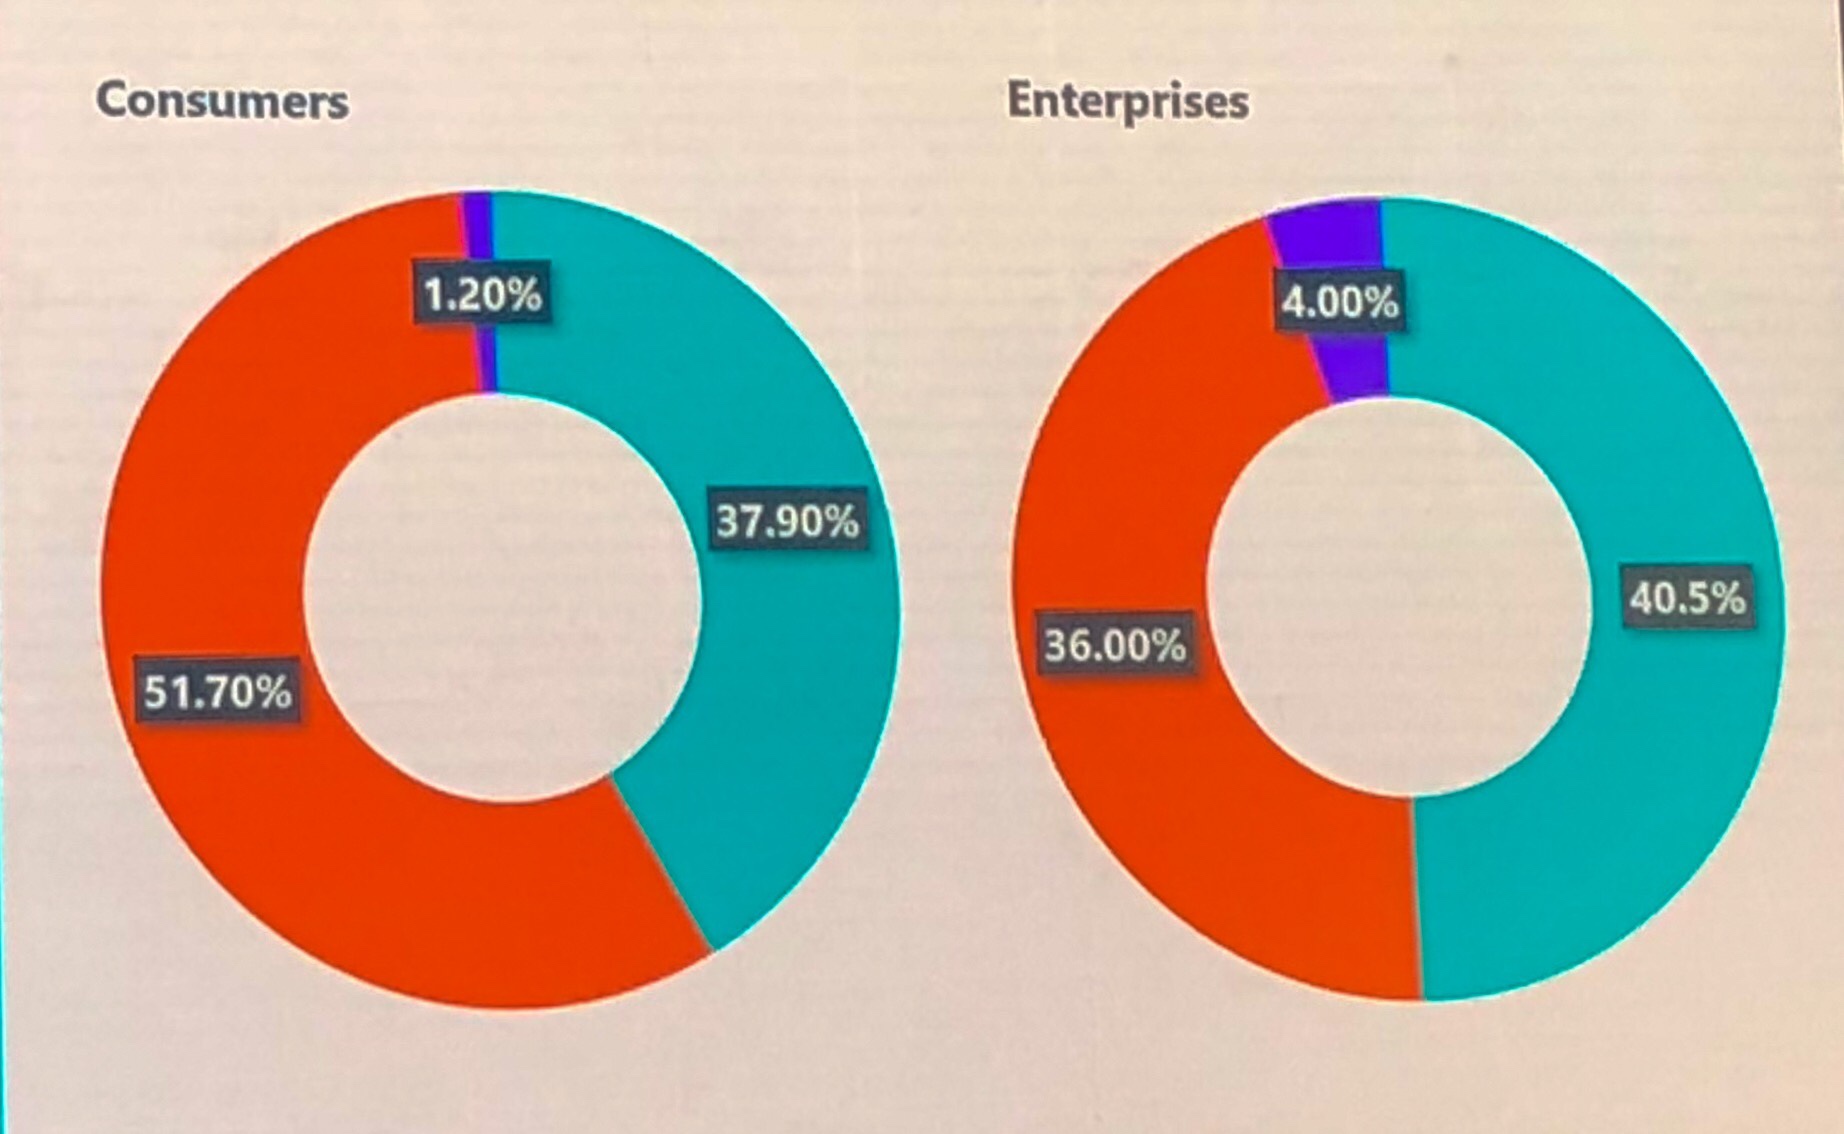
If your graphs don’t visually illustrate the percentages associated with them I literally stop listening to the point being made.
It’s often not the speakers fault, and I don’t consciously stop listening up in my high horse, I just get so caught up in the inaccuracy that I can’t focus on what’s being said.
